Organic
Chemistry
II | Lecture | Laboratory
Organic Chemistry Laboratory II
Determination of pKa
Values of Substituted Benzoic Acids
Experiment Description
Introduction
Students will work in pairs to
determine the pKa (acidity constant) of benzoic acid or a
substituted benzoic acid by titration with NaOH.
The following experiment is modified
from a procedure described in “Organic Laboratory: Microscale and
Standard Scale Experiments”, 4th edition by John A.
Landgrebe (1993).
The pKas will be determined for the twelve benzoic
acids given in the Table 1. Students will measure the
equivalence points of benzoic acids using a computer and the
interface probes for measuring pH. The pKas that are
measured will be related to the specific substituent of the
benzene ring and compared to the pKa of benzoic acid to determine
if the substituent is electron-donating or
electron-withdrawing. Using the experimental data and the
Hammett equation, students will also determine the sigma value for
each substituent . All groups will work together to generate
a plot of sigma values for all substituents. The following
substituted benzoic acids will be used. The pKa values for
these compounds were found in the “CRC Handbook of Tables for
Organic Compound Identification”, 3rd edition, pp. 428-433.
|
Acid
|
Literature pKa
|
Acid
|
Literature pKa
|
|
Benzoic Acid
|
4.20
|
2-Nitrobenzoic Acid
|
2.22
|
|
Salicylic Acid
|
2.75
|
3-Nitrobenzoic Acid
|
3.44
|
|
3-Hydroxybenzoic Acid
|
3.90
|
2-Toluic Acid
|
3.91
|
|
4-Hydroxybenzoic Acid
|
4.61
|
3-Toluic Acid
|
4.27
|
|
2-Chlorobenzoic Acid
|
2.92
|
4-Toluic Acid
|
4.37
|
|
3-Chlorobenzoic Acid
|
3.82
|
4-Chlorobenzoic Acid
|
3.98
|
Table 1: Acidity constants of Benzoic Acid and
Substituted Benzoic Acids
Procedure
Calibrate
the pH Probe
Plug
the pH probe
into the GO-LINK, then plug the GO-LINK into a USB port of
your computer. Start loggerpro (on PC– Start->search->
type logger then select logger pro). The program should be
displaying an uncalibrated pH value in the lower left. Unscrew the vial from the
bottom of the pH probe and slide the cap up the probe. Rinse
the electrode thoroughly with de-ionized (DI) water into a
large beaker. NEVER LET THE GLASS BULB ON THE BOTTOM OF
THE PROBE DRY OUT. NEVER TOUCH THE GLASS BULB TO ANY
SURFACE. In loggerpro go to Experiment → calibrate →
Golink: 1 pH. A screen will pop up. Click “calibrate
now”. Place the probe in the vial containing the pH 10
buffer and swirl gently. Wait till the voltage in the center
right stabilizes, then in the “Reading 1” box type “10.0”
(without the quotes) and click keep. Rinse the probe
THOUROUGHLY with DI water. Place the probe in the pH 4 buffer
and again wait for the voltage to stabilize. Put “4.0” (without
the quotes) in
“Reading 2” and click keep. Then click the “done” button. At
this point the pH display should be reading 3.97 – 4.03.
Rinse
the probe thoroughly and place it in the pH 7 buffer for a
few seconds. If the pH doesn't read 6.95 – 7.05, contact
your instructor.
Dispense the Acid
Solutions of the benzoic acids have been prepared in 50%
ethanol. Dispense exactly 50 ml of the acid solution using
volumetric pipets to measure the 50 ml into a 150ml beaker
containing a magnetic stirring bar. Two acids will be set out
on each bench. Each acid will be titrated twice. Two
students at the bench will titrate one acid and two students at the
bench will titrate the other acid. Record the name of the acid
you use in your notebook.
Recording the Data
Download and open the Excel file
here to record your data.
Save the file as an Excel Workbook using your last name and
followed by titrationdata. (eg. hass_titrationdata.xls).
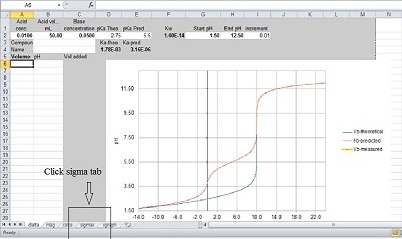
Enter
your name in the “name” cell on the spreadsheet. Enter the
name of your compound in the “Compound” cell. Put the theoretical
pKa value for your compound from the table above into the
“pKa-Theo” cell. A graph on the right in the Excel file
appears. The blue line on the graph is the theoretical
curve for your compound if the titration was in pure water,
not 50% ethanol. The red line is the predicted titration curve
in 50% ethanol. You must enter data into the two
columns, volume and pH. Enter the
volume reading on the buret, (not the quantity you
added). As you enter your data, a yellow line will appear that
represents your experimental tiration curve. Do
not change other cells, as that might skew your results.
|
Titrating
the Acid
Place the
beaker on a stirplate underneath the burette
containing 50 mM NaOH. Clamp the pH
probe on a slight angle into the solution. (Figure 1).
The “crown” on the bottom of the electrode must be
fully immersed in the solution, BUT high enough to not
get hit by the stirbar.
If the probe is getting hit by the moving
stirbar, it will cause erroneous results, damage to
the probe, and a frowny-face to appear on your
instructor. Begin stirring the solution.
Once
the
pH stabilizes, record the initial pH reading of the
benzoic acid solution and the volume reading on the
burette into your spreadsheet. Note the numbers get
bigger as you add more solution. NaOH will be
added to the benzoic acid solution in volumetric
increments (starting with 0.3mL) that produce a change
in pH of less than 0.2 pH units (~0.5-1.5 ml). The solution
will be allowed to equilibrate until stable then a pH
reading will be taken.
Initially
add
~0.3 mL volumes of NaOH. Note volume and pH each
time. When the pH change is > 0.10 pH unit
increase volume added to 0.5mL each time. If the pH
change becomes close to or greater than 0.2,
decrease volumes added to ~0.3 mL. When the
change in pH becomes < 0.05 for three consecutive
readings (~pH 12.1), stop the titration.
On
the right, in yellow, your experimental titration
curve will appear in the Excel file. Save the
file.
|
|
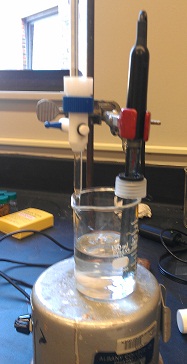
Figure 1: Titration Set-Up
|
|
Determine the Endpoint and the Initial Acid
Concentration from the Titration Curve
The endpoint and the
concentration of the acid must be determined. The endpoint
is defined as the quantity of base (typically in ml) needed to
neutralize (or completely ionize) the acid. Since we are using
monoacid compounds the stoichiometry of base to acid is 1:1.
For each mole of NaOH used, one mole of acid is ionized.
The endpoint and the concentration of the benzoic acid solution
can determined from the titration curve in the following way.
Using the graph (not the table), identify the volume of base added
at the lower inflection point of the curve (i.e., where it just
starts to go straight up). This value can be found by
dragging the cursor over that point and the volume value will be
represented by the first number. Record this volume.
Using the graph again, identify the volume of base added at the
higher inflection point of the curve (i.e., where it just starts
to curve and level out). Record this volume. Average the two
values. This will be your endpoint NaOH volume. The
concentration of acid can be determined from the endpoint and the
concentration of the NaOH solution (0.05M). Calculate the
number of moles of NaOH that was used to completely ionize the
monoacidic benzoic acid.
|
|
|
|
|
Determine the midpoint
and the pKa of the acid
The pKa of the acid must be determined. The titration curve is
also used to determine the pKa. First, the midpoint,
the volume of base needed to ionize half the acid present, is
calculated from the endpoint. The midpoint can
be determined by dividing the endpoint by 2. For example, if
the volume of base is 4 ml, the midpoint is 2 ml.
The pKa of the acid is then determined from the pH of the
solution at the midpoint, and the Hendersohn-Hasselbach
equation. Determine the pH at the midpoint using the
titration curve. At this pH, 50% of the acid is ionized
(conjugate base) and 50% is unionized (acid). At this
pH, [CB]/[A] =1.
| The pKa
of the acid is also used to determine the pKa. First,
the midpoint,
the volume of base needed to ionize half the acid present,
is calculated from the endpoint. The midpoint can be
determined by dividing the endpoint by 2. For example,
if the volume of base is 4 ml, the midpoint is 2 ml. The pKa
of the acid is then determined from the pH of the solution
at the midpoint, and the Hendersohn-Hasselbach
equation. Determine the pH at the midpoint using
the titration curve. At this pH, 50% of the acid is
ionized (conjugate base) and 50% is unionized (acid).
At this pH, Ka = [CB]/[A] =1. Enter the pKa value that
you calculated into the “pKa-pred”
cell in the spreadsheet. The red line now indicates
the the predicted titration curve for your pKa value
you entered. Save the file. |
|
|
|
Mean and Standard Deviation of pKa Values Determined by the
Class
THIS MUST BE DONE BEFORE LEAVING THE
LAB!
Each lab section will determine
the pKa values for all 12 of the benzoic acids listed in Table 1.
This data will be shared by the entire class and will be needed
for you to complete the post-lab assignment. In oder to do
this, all students need to upload their data to a website that can
be accessed at:
http://www.trentnet.net/acp-pka.
Upon entering this site, you will be required to enter your ACPHS
email account email (full name ie.
Matt.groening@acphs.edu)
twice. Enter your lab section by
letter (A, B, C, D etc...
). (Click
here if
you do not know/remember the letter designation of your lab
day). Enter your bench by letter, and postion on the bench
(A-west-1, etc). You will then need to enter the name of the
acid that you titrated, the experimental endpoint that you
measured, the experimental midpoint volume, and the pKa
value that you calculated. After all students from all lab
sections have entered their data, a class Excel file will e
compiled and will be available for students to download on or
after March 20, 2013. You will need to access this file to
complete the remaining part of the experiment, i.e., calculating
the Ka and sigma values.
Download the Class Data File and Calculating Ka and
Sigma (s) Values
Downloading the Class File
Download the compiled
data file from: http://www.trentnet.net/acp-pKa-data.cvs
and save the file
as an Excel Workbook to your computer as
class_pKadata.xls. This file will contain all of
the class pKa data. Open the this file
(class_pKadata.xls) and enter control-a (hold ctrl and a
at the same time), then control-c (control and c
at the same time). Open the spreadsheet you used to
collect your titration data
(lastname_titrationdata.xls) Go to the “sigmas”
tab on this spreadsheet (see Figure at right) and put the cursor
into cell A1 on sigma page. Enter control-v (control and
v at the same time). Most of the data analysis will be
done automatically on the sigma page of this spreadsheet
including the average pKa value determined by all
students in all sections in the class and from this
data, the sigma values for each substitutent studied in
this experiment. A description of how these values are
determined is shown below. Save the file
as an Excel Workbook (lastname_titrationdata.xls.). |
|
|
|
|
|
|
The
Excel file should automatically calculate the average pKa
values for each acid that was determined by the class.
The average Ka values are then determined from the mean pKa
values (pKa = -log Ka) . Sigma (s)
values for substituents of substituted benzoic acids are
then determined from the Ka values and the Hammett equation.
Rho is a constant
equal to 1.46 and is used for benzoic acid and all
substituted benzoic acids. |
Sample Sigma Value Calculation
A example calculation of the sigma value
for a meta- chloro- substitutent (m-chlorobenzoic
acid) is given on the right. The literature pKa value
of benzoic acid is 4.2 and for m-chlorobenzoic acid, the pKa
value is 3.77 (determined in water).
|
|
|
|
|
|
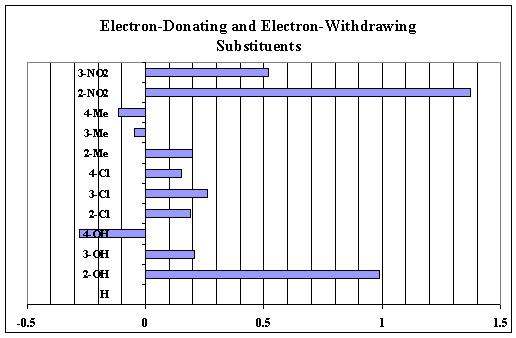
When all of the sigma values are calculated, they
are plotted relative to each other. The electron-dontaing
substituenmts have negative sigma values (to the left on the graph)
and the electron-withdrawing groups have positive sigma values and
are plotted to the right on the graph.
Complete the datasheet as the
post-lab assignment for this experiment.
Waste Disposal
The pH of aqueous solutions should be checked prior to
disposal. Acidic solutions should be disposed of in "acidic
aqueous waste" and basic solutions in "basic aqueous waste".